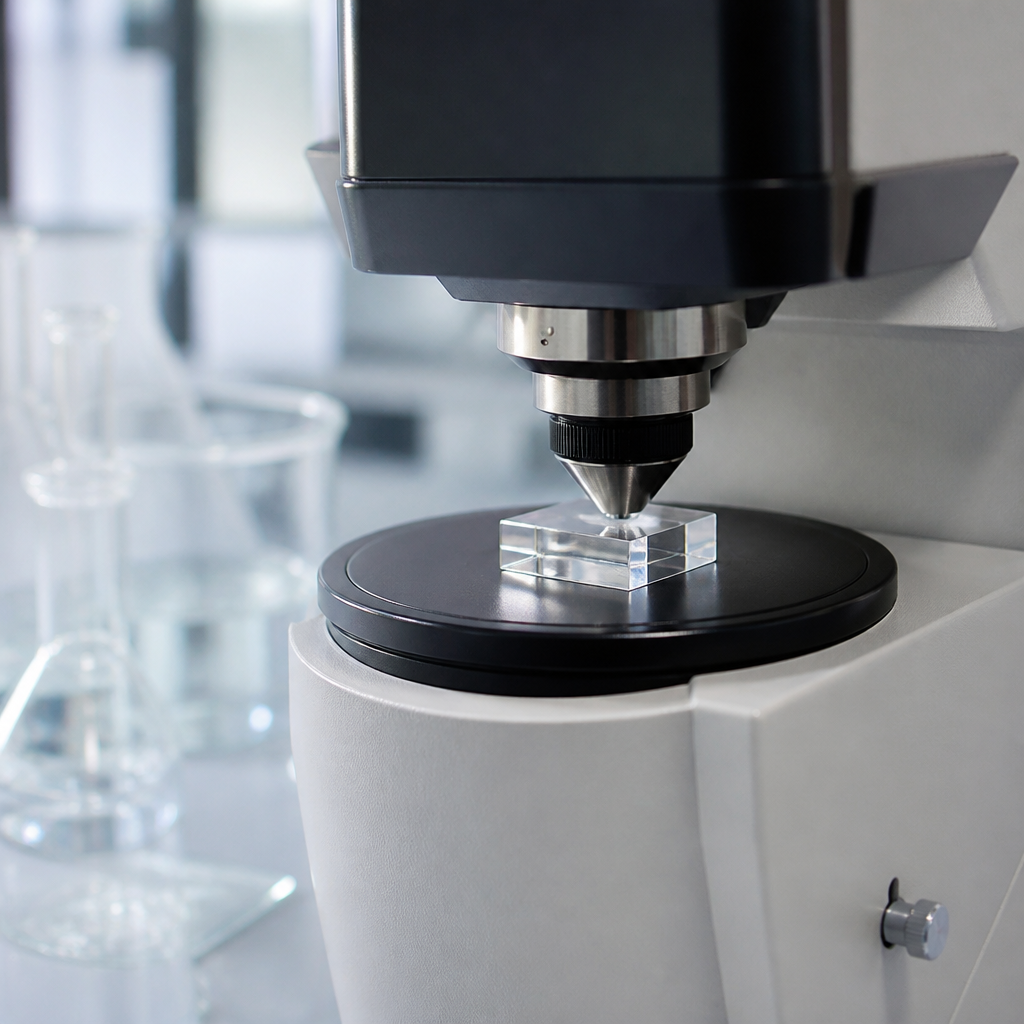
Evaluating the refractive index of polymer materials is a foundational task in optical engineering, product design, quality control, and materials research because refractive index governs how polymers bend, transmit, reflect, and scatter light across real applications. In simple terms, refractive index describes the ratio between the speed of light in vacuum and the speed of light in a material. A higher value means light travels more slowly through that polymer and changes direction more strongly at an interface. In practice, that single number affects lens performance, display clarity, sensor accuracy, adhesive visibility, film gloss, and even how defects appear during inspection. I have evaluated polymer optics for molded parts, coated films, and optical adhesives, and the same lesson repeats: if refractive index is treated as a catalog value instead of a measured property tied to wavelength, temperature, and processing history, design errors follow quickly.
For polymer materials, refractive index rarely stands alone. It connects directly to transmission, haze, birefringence, reflectance, dispersion, Abbe number, and matching between layers in multilayer stacks. An acrylic light guide, a polycarbonate headlamp lens, a cyclic olefin copolymer microfluidic chip, and an epoxy encapsulant may all be called transparent polymers, yet their optical behavior differs substantially because molecular structure, additives, crystallinity, orientation, and moisture uptake alter the way light propagates. That is why a proper evaluation must define the test method, the wavelength or spectral range, polarization if relevant, and environmental conditions. This hub article explains the core concepts, the principal measurement methods, the variables that change results, and the practical interpretation needed when selecting polymers for optical applications. It also serves as a gateway topic within optical properties, linking naturally to deeper work on transmittance, haze, birefringence, color, surface finish, and optical durability.
What refractive index means in polymers and why it matters
Refractive index, commonly written as n, determines the degree of refraction at a boundary according to Snell’s law. For engineers, its importance becomes tangible at interfaces. Fresnel reflection at normal incidence is approximately ((n1-n2)/(n1+n2))², so even a small mismatch between air and polymer creates measurable surface reflection. For example, polymethyl methacrylate typically sits around 1.49 in the visible region, polycarbonate around 1.58, and polystyrene near 1.59. Those differences look small numerically, but they influence lens power, glare, coupling efficiency into fibers or waveguides, and the visual contrast of bonded layers. When I have matched adhesives to substrates in display laminations, reducing index mismatch by only a few hundredths noticeably lowered interface visibility and improved perceived clarity.
Index also shapes optical design through dispersion, the dependence of refractive index on wavelength. Most polymers show normal dispersion, meaning n decreases as wavelength increases. This matters because a polymer lens optimized at 589 nanometers, the sodium D line used in many specifications, may focus blue and red light differently. Designers therefore use spectral refractive index data or an Abbe number rather than a single value. In packaging and films, refractive index helps predict gloss and opacity when combined with scattering from fillers or crystallites. In semicrystalline polymers such as polypropylene or PET, morphology contributes strongly to optical appearance. In oriented films, direction-dependent refractive index creates birefringence, which can be beneficial in retardation films or problematic in molded optics where stress birefringence degrades image quality.
How refractive index is measured and reported
The most widely used production method is refractometry, especially with an Abbe refractometer for liquids and some solid samples using index-matching contact. For precision polymer work, however, measurement selection depends on the sample form. Thin films are often characterized by ellipsometry, prism coupling, or spectroscopic fitting from reflection and transmission data. Bulk transparent plaques can be tested with minimum deviation prism methods, critical angle instruments, or interferometric techniques. ASTM D542 is commonly cited for the refractive index of transparent organic plastics and uses a refractometer approach at controlled temperature, typically reported as nD at 25 degrees Celsius. ISO methods may be used in international supply chains, but the essential requirement is to state wavelength and temperature explicitly.
Good reporting includes more than one number. At minimum, a useful data line names the material grade, conditioning, molding or film orientation history, test temperature, wavelength, and uncertainty. If the part will operate outside room temperature, thermo-optic behavior matters because dn/dT for polymers is usually negative, meaning refractive index decreases as temperature rises. Moisture can also shift values in hygroscopic polymers such as nylon. Additives complicate interpretation further. Plasticizers, flame retardants, impact modifiers, pigments, and nanofillers may each alter n and, more importantly, increase absorption or scattering. I have seen a datasheet index copied into a design file for an injection-molded optical component, only for the final molded part to miss optical targets because internal orientation and additive package changed the effective result. Measuring the actual finished article prevents that failure mode.
Methods, strengths, and limitations across common polymer sample types
No single test method fits every polymer optic. The right choice depends on transparency, geometry, required accuracy, and whether the goal is routine quality control or full optical characterization. In development work, I usually combine a fast screening method with a spectral technique so the team captures both a nominal value and wavelength dependence. The comparison below reflects how these methods are used in laboratories and manufacturing environments.
| Method | Best suited sample | Typical advantage | Main limitation |
|---|---|---|---|
| Abbe refractometer | Transparent solids with polished contact surface, liquids, resins | Fast, familiar, cost-effective for routine checks | Usually single wavelength and sensitive to surface condition |
| Prism minimum deviation | Machined or molded prism specimens | High accuracy for bulk materials | Requires precise specimen geometry |
| Spectroscopic ellipsometry | Thin films, coatings, multilayers | Provides spectral n and k with thickness modeling | Needs optical model expertise and smooth surfaces |
| Prism coupling | Waveguiding films and planar optical layers | Measures mode indices directly | Limited to suitable film structures |
| Interferometry | High-quality transparent slabs and precision optics | Excellent sensitivity to optical path length | Setup complexity and tight alignment requirements |
Surface quality and sample preparation often dominate measurement quality. A rough or curved molded face can create contact gaps or beam deviation errors, while residual stress may make the result polarization dependent. Films require attention to thickness uniformity and orientation direction. In multilayer constructions, a measured effective index may hide the fact that each layer has different optical constants. For absorbing materials, the extinction coefficient k should be evaluated alongside n because a reported refractive index without absorption context can mislead designers. This is especially relevant in UV-curable coatings, colored polymers, and infrared-transmitting specialty materials. The most reliable practice is to choose a method matched to the product architecture, document all conditions, and verify with a second technique whenever the application is sensitive to small optical losses.
Material structure, processing, and environment as drivers of refractive index
Polymer refractive index originates from molecular polarizability and density, so chemistry sets the baseline. Aromatic groups generally increase refractive index; that is one reason polystyrene and polycarbonate sit higher than polyethylene. Sulfur-containing and halogenated structures can raise n further, which is useful in specialty optical resins and high-index coatings. Density changes matter too. As free volume decreases, index often rises slightly. Because of that link, cure shrinkage in thermosets, physical aging in glassy polymers, or drawing in films can shift optical response. The Lorentz-Lorenz relationship is not perfect for every formulation, but it gives a useful conceptual bridge between composition, density, and refractive index.
Processing introduces another layer of complexity. Injection molding can freeze molecular orientation near the gate and skin layer, producing anisotropy and spatial index variation. Extruded films often show machine-direction and transverse-direction differences that affect polarization behavior. Annealing may relax stress and reduce birefringence without greatly altering isotropic index, while crystallization can increase haze and change effective optical properties through both refractive contrast and microstructure. Environmental exposure then adds time dependence. Water absorption in polyamides and some polyurethanes modifies density and polar interactions; temperature cycling can create internal stress; UV aging can yellow the polymer and change absorption bands. In outdoor optics such as lighting covers or sensor windows, refractive index evaluation should be paired with weathering tests and spectral transmission measurements so the material is judged in the state it will actually experience in service.
Applying refractive index data in lenses, films, coatings, and bonded assemblies
In polymer lenses, refractive index directly affects curvature requirements and chromatic performance. A higher-index resin can achieve the same optical power with flatter surfaces, which may reduce thickness and mass. That benefit is balanced against dispersion, moldability, and durability. Polycarbonate, for example, offers impact resistance and relatively high n for molded optics, but stress birefringence and moisture-sensitive processing must be controlled. PMMA delivers excellent visible transmission and weatherability, making it a standard for outdoor lenses and light guides, though its lower impact strength changes design choices. Cyclic olefin polymers and copolymers are favored in precision diagnostics and micro-optics because they combine good transparency, low water uptake, and stable optical properties.
For films and coatings, index matching determines whether interfaces disappear or become visible. Anti-reflective stacks depend on carefully selected optical thickness and index contrast. Barrier coatings on packaging, hard coats on displays, and optical adhesives in touch panels all rely on the same principle: every interface either preserves or disrupts light depending on n mismatch, roughness, and absorption. A practical example is a cover lens bonded to a display with an optically clear adhesive. If air gaps remain, reflections increase sharply because the air-polymer interface is optically strong. Replace that gap with a well-matched adhesive and reflected light drops while readability improves. In fiber-optic or waveguide structures, core and cladding materials are selected by their relative refractive indices, often within small deltas. Here, small measurement errors can translate into large changes in numerical aperture or coupling efficiency, so spectral and temperature-dependent data are essential rather than optional.
Best practices for interpreting data across the wider optical properties landscape
Refractive index should never be interpreted in isolation when the goal is polymer selection. It belongs within a broader optical property framework that includes total transmittance, haze, clarity, birefringence, gloss, yellowness index, UV stability, and surface topography. A material can have an attractive n value yet still fail because scattering from fillers raises haze, because residual stress creates double images, or because yellowing shifts color in service. In technical reviews, I ask three direct questions: at what wavelength was n measured, under what thermal and moisture condition, and on what exact specimen form? Those answers usually reveal whether data from suppliers, lab studies, and production parts are actually comparable.
As the hub topic for optical properties, refractive index provides the organizing principle for several related evaluations. Transmission testing explains how much light gets through. Haze and clarity testing describe how much of that light remains useful for vision. Birefringence analysis shows whether optical behavior changes with direction or stress. Reflectance, gloss, and color measurement capture what users ultimately see. Build your materials workflow so these properties are linked rather than siloed, and decisions become more reliable. Start with the actual end-use geometry, measure refractive index under realistic conditions, and connect the result to neighboring optical tests. That approach reduces redesign cycles, improves supplier conversations, and leads to polymer optical systems that perform as intended.
Frequently Asked Questions
What does refractive index mean for polymer materials, and why is it so important?
Refractive index is a basic optical property that describes how much light slows down and changes direction when it enters a polymer from air or another medium. Technically, it is the ratio of the speed of light in vacuum to the speed of light in the material. In practical terms, it tells engineers and materials scientists how a polymer will bend, transmit, reflect, and scatter light. This matters because many polymer applications depend on predictable optical behavior, from lenses, light guides, and display films to packaging, coatings, sensors, and medical components.
For polymers, refractive index is especially important because small differences can lead to noticeable changes in performance. A mismatch in refractive index can increase reflection losses at interfaces, reduce transparency, create haze, or disrupt optical alignment in precision assemblies. In multilayer products, it can determine whether light is confined, transmitted efficiently, or scattered. In filled or blended polymers, it can also reveal formulation consistency and phase behavior. That is why evaluating refractive index is not just an academic measurement; it is a practical quality and design parameter that supports material selection, process control, and end-use reliability.
How is the refractive index of a polymer typically measured?
Several methods are used to evaluate the refractive index of polymer materials, and the best choice depends on whether the sample is a liquid resin, a transparent solid, a thin film, or a finished part. One of the most common tools is an Abbe refractometer, which is widely used for liquids and some solid samples with good surface contact. For thin films and precision optical materials, ellipsometry, prism coupling, or spectroscopic techniques may be used. In research and advanced quality control, instruments that measure refractive index across different wavelengths can provide a more complete optical profile.
Accurate measurement depends heavily on sample preparation and test conditions. The polymer surface should be clean, smooth, and free of contamination, scratches, bubbles, or internal defects that could distort the reading. Temperature control is also critical because refractive index changes with temperature, and many polymers are sensitive to thermal expansion and structural relaxation. Wavelength matters as well, since refractive index is dispersive and can vary across the visible or infrared spectrum. For that reason, a refractive index value should ideally be reported together with the measurement temperature and wavelength, such as at 589 nanometers and 23 degrees Celsius. Without that context, the number can be misleading or difficult to compare.
What factors can affect the refractive index of a polymer?
The refractive index of a polymer is influenced by its chemical structure, density, molecular arrangement, and additives. Polymers with more polarizable molecular groups, aromatic rings, halogenated units, or sulfur-containing structures often show higher refractive indices because their electrons respond more strongly to an electromagnetic field. Density also plays a role, since tighter molecular packing generally increases optical interaction and can raise the refractive index. Crystallinity, orientation, and residual stress can further modify how light behaves within the material, especially in semi-crystalline or stretched films.
Processing and formulation variables can have a major impact as well. Fillers, pigments, plasticizers, flame retardants, and reinforcing agents may shift the refractive index upward or downward depending on their own optical properties and how uniformly they are dispersed. Moisture absorption can alter readings in hygroscopic polymers, and incomplete curing in thermosets or UV-curable systems can lead to unstable values. Even lot-to-lot variation in raw materials can produce measurable differences. Because of these influences, refractive index is often used as a sensitive indicator of composition, process consistency, and material quality, not just as a standalone optical property.
Why do wavelength and temperature matter when evaluating polymer refractive index?
Wavelength and temperature matter because refractive index is not a fixed constant under all conditions. Most polymers exhibit optical dispersion, meaning their refractive index changes with wavelength. Typically, the index is higher at shorter wavelengths and lower at longer wavelengths, although the exact behavior depends on the polymer chemistry. This is important in optical engineering because a material that performs well under one light source may behave differently under another. For example, a polymer used in visible-light optics may need different characterization than one used in infrared sensing or ultraviolet exposure environments.
Temperature changes also affect refractive index by altering polymer density and molecular motion. As temperature rises, polymers often expand slightly and become less optically dense, which can lower the refractive index. In some materials, thermal history, annealing, or glass transition effects can introduce additional changes. If measurements are taken without tight temperature control, the resulting data may not be reproducible or comparable across labs and production sites. That is why authoritative refractive index data should always specify the test wavelength and temperature. In design and quality work, this ensures the value reflects the actual service conditions rather than an isolated lab number.
How is refractive index data used in polymer design, quality control, and materials research?
In product design, refractive index helps determine whether a polymer is suitable for a specific optical function. Engineers use it to choose materials for lenses, windows, waveguides, encapsulants, adhesives, coatings, and multilayer structures where light transmission and interface behavior are critical. It can guide matching between polymers and glass, help reduce Fresnel reflections, and support the design of transparent or low-haze products. In display technology, lighting, and sensing systems, refractive index data is often essential for modeling optical paths and predicting real-world performance before a prototype is built.
In quality control, refractive index serves as a fast and sensitive verification tool. A measured value can confirm incoming raw material identity, monitor batch uniformity, detect contamination, and reveal formulation drift. Because the property responds to composition and structure, it can also be used to check cure state, solvent retention, moisture uptake, or blend consistency. In research, refractive index data supports deeper understanding of structure-property relationships, especially when studying new copolymers, composites, nanofilled systems, or functional films. When interpreted carefully alongside density, spectroscopy, thermal analysis, and microscopy, refractive index becomes a highly useful bridge between polymer chemistry and optical performance.