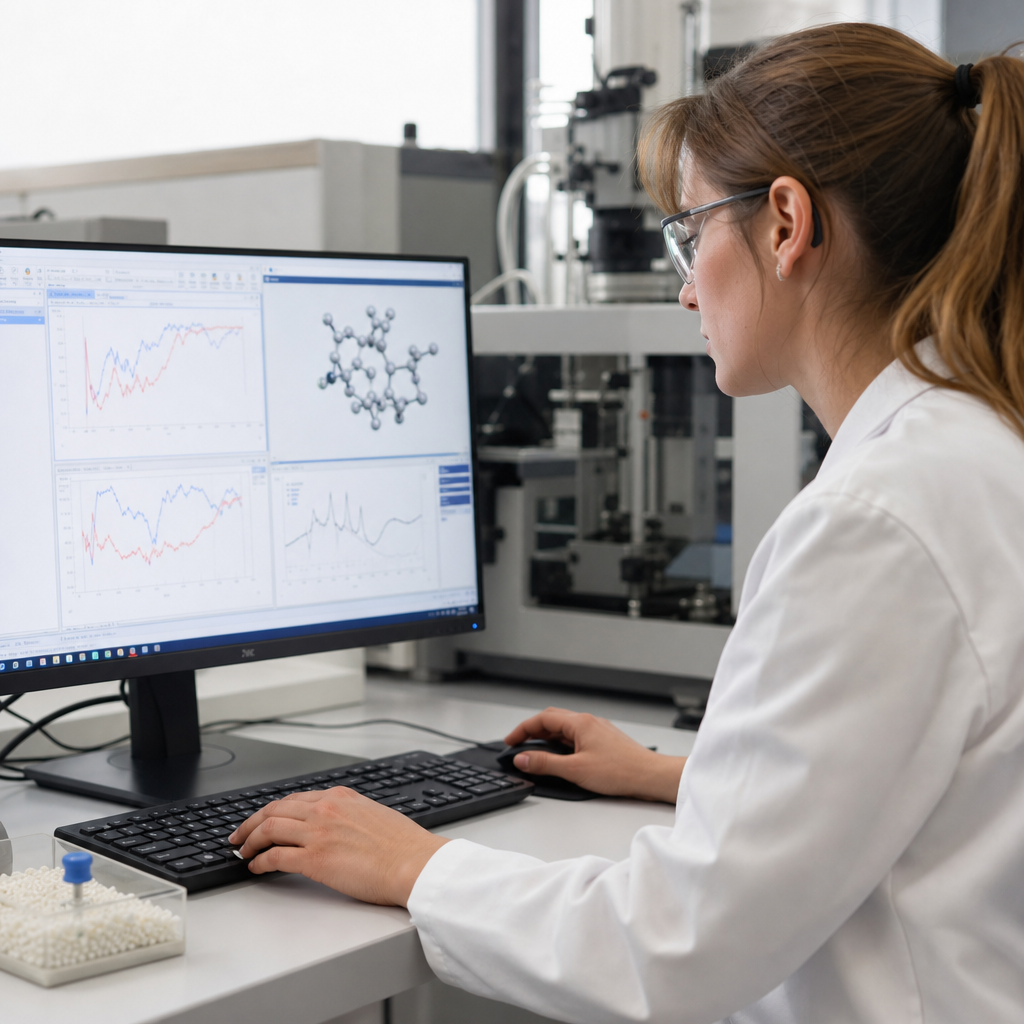
Online tools have changed polymer data analysis from a specialized desktop task into a faster, more collaborative workflow that students, researchers, and engineers can access from anywhere. In practical terms, polymer data analysis means converting raw measurements from techniques such as differential scanning calorimetry, gel permeation chromatography, dynamic mechanical analysis, spectroscopy, rheology, and tensile testing into interpretable material properties. Online tools include browser-based calculators, cloud notebooks, vendor portals, electronic lab notebooks, shared dashboards, and web applications that process, visualize, and compare polymer datasets. This matters because polymer development depends on small differences in molecular weight distribution, crystallinity, glass transition temperature, viscoelastic response, and degradation behavior, and those differences are easy to misread when files are scattered across laptops and unsupported spreadsheets. I have seen teams lose weeks because a viscosity curve was exported with the wrong units, or because no one could reproduce a fit generated on one analyst’s workstation. A well-chosen online workflow solves those problems by centralizing data, standardizing analysis, and making results traceable. As a hub topic, online resources for polymer analysis also connect to learning materials, software tutorials, reference databases, and collaborative reporting methods that help readers move from basic plotting to defensible materials decisions.
The key advantage of using online tools for polymer data analysis is not convenience alone; it is consistency. Browser-based platforms can enforce templates for sample naming, metadata capture, instrument settings, and report generation. That structure reduces common errors, especially in educational labs and multi-user research groups. It also helps when comparing data across methods. For example, a student characterizing polylactic acid may need to link GPC results showing chain scission, DSC traces showing reduced crystallinity, and tensile data showing embrittlement after hydrolysis. If each dataset lives in a different format with no shared identifiers, the story remains fragmented. When the same datasets are uploaded into a cloud environment with consistent naming and version history, the material behavior becomes clear. This article explains how to choose online resources, prepare polymer datasets, analyze common property types, validate outputs, and build repeatable workflows. It is designed as a hub under educational resources, so it emphasizes not only the tools themselves but also the surrounding references, training pathways, and practical decision criteria that make those tools genuinely useful.
Choose the Right Online Tool for the Polymer Question
The first rule is simple: match the tool to the material question, not to the file format you happen to have. If the question is “What is the molecular weight distribution?” you need software that can calibrate chromatograms, integrate peaks, and report Mn, Mw, Mz, and dispersity from GPC or SEC data. If the question is “Where is the glass transition?” then the tool must support baseline selection and thermal event interpretation for DSC or DMA. For viscoelastic modeling, you need fitting functions for storage modulus, loss modulus, complex viscosity, time-temperature superposition, and master curve construction. General plotting apps can visualize data, but they rarely provide the domain-specific constraints polymer work requires. In my own projects, the biggest efficiency gain came when we stopped forcing universal spreadsheet templates onto every technique and instead adopted method-specific cloud tools linked through a common project dashboard.
Useful categories of online resources include scientific notebook platforms such as JupyterHub and Google Colab, materials informatics environments such as Citrine and Polymer Genome, chemistry data platforms such as Benchling, shared dashboards built in Power BI or Tableau, vendor cloud ecosystems for thermal analysis and spectroscopy, and web databases maintained by NIST, MatWeb, and CAMPUS. Each serves a different role. Colab is excellent for scripted regression, smoothing, and custom plotting when students need transparency. MatWeb is useful for quick property benchmarks, though values must always be checked against grade-specific datasheets. NIST resources help with reference standards and data practices. Vendor portals can streamline raw file import, but users should watch for opaque default parameters. A sound educational workflow usually combines a reference database, a browser analysis environment, and a collaboration layer for documentation.
| Need | Best Online Resource Type | Typical Polymer Use | Main Caution |
|---|---|---|---|
| Quick property lookup | Reference database | Compare modulus, density, Tg, melting point | Values may differ by grade, processing history, and test standard |
| Custom calculations | Cloud notebook | Fit viscosity models, calculate crystallinity, clean data | Requires coding discipline and documented assumptions |
| Team reporting | Dashboard or ELN | Track sample lineage, upload plots, share conclusions | Metadata quality determines usefulness |
| Instrument-specific processing | Vendor web platform | Analyze DSC, TGA, FTIR, DMA, GPC exports | Default settings can hide analytical choices |
Prepare Polymer Data Before Uploading Anything
Online polymer data analysis is only as reliable as the uploaded dataset. Before using any web tool, standardize units, filenames, and metadata. For molecular weight work, record solvent, column set, calibration method, detector type, and dn/dc if light scattering or refractive index calculations are involved. For DSC, capture sample mass, heating rate, atmosphere, pan type, thermal history, and whether the trace is first heat, cool, or second heat. For rheology, note geometry, gap, strain amplitude, frequency range, temperature program, and whether the measurement stayed within the linear viscoelastic region. These details are not optional. They determine whether a curve can be interpreted at all. I have reviewed student datasets labeled only “sample 3 final,” which is effectively unusable once several formulations accumulate.
Data cleaning should happen before interpretation. Check for decimal and delimiter issues in CSV files, missing headers, duplicated time points, clipped peaks, and instrument-exported text strings that can break parsers. Confirm unit consistency, especially with stress reported in MPa versus psi, viscosity in Pa·s versus cP, and temperature in Celsius versus Kelvin for modeling work. Many online notebooks can automate these checks with simple validation scripts. A useful educational practice is to build an upload checklist that rejects incomplete files. That may feel strict, but it prevents false conclusions later. Good preparation also includes assigning sample identifiers that connect composition, processing route, and test condition. A code like “PLA10PEG_Annealed_80C_24h_DSC2” conveys far more analytical value than “run7.”
Analyze Thermal, Mechanical, and Molecular Data Online
Different polymer techniques demand different analysis logic. For DSC, online tools should let you define baselines clearly, integrate melting and crystallization enthalpies, and estimate crystallinity using literature enthalpy values for a fully crystalline reference. For example, isotactic polypropylene crystallinity is often estimated using a reference enthalpy near 207 J/g, while polyethylene terephthalate uses a different standard depending on the source and crystalline form. A browser notebook can calculate crystallinity across a sample set and chart it against annealing conditions, making trends visible quickly. For TGA, cloud tools are helpful for derivative mass loss plots and onset temperature extraction, especially when comparing stabilizer packages or moisture content effects. The key is to document every baseline and threshold assumption, because thermal results are sensitive to those choices.
For GPC or SEC, online analysis should distinguish between relative and absolute molecular weight methods. Relative calibration against polystyrene standards is common, but branched or chemically dissimilar polymers can give misleading values if hydrodynamic volume differs. If multi-angle light scattering data are available, a better online workflow calculates absolute molecular weight using proper dn/dc and detector normalization. For rheology, browser-based fitting can be powerful when implementing Cross, Carreau-Yasuda, or power-law models, or when generating time-temperature superposition master curves with Williams-Landel-Ferry or Arrhenius shifting. For mechanical data, stress-strain analysis benefits from scripts that automatically locate modulus regions, yield points, elongation at break, and energy absorption. In educational settings, these tools are especially useful because they reveal how analytical decisions affect results rather than hiding them behind a single export button.
Use Online Resources to Compare Materials and Learn Faster
The hub value of online resources is that they combine analysis with learning. A reader studying polyethylene, polystyrene, nylon, and PEEK should not only process data but also place results in context using databases, standards, and tutorials. ASTM and ISO test methods matter here. A tensile modulus reported under ASTM D638 is not automatically interchangeable with a value obtained under a different specimen geometry or conditioning protocol. Online reference pages, vendor application notes, and standards summaries help users understand why two apparently similar datasets disagree. In teaching labs, I recommend assigning students to compare their measured Tg or modulus against published ranges and then explain any deviations using processing history, molecular architecture, plasticizer content, moisture uptake, or degree of crystallinity. That exercise builds judgment, not just plotting skills.
Online communities and documentation also shorten the learning curve. Public notebooks on GitHub, documentation for Python libraries such as pandas, NumPy, SciPy, and Plotly, and tutorials from instrument vendors can show exactly how to smooth noisy DMA data, fit a sigmoidal transition, or batch-process FTIR spectra. The best educational use is not copying code blindly but adapting reviewed workflows to a defined materials problem. For instance, an instructor can provide a Colab notebook that imports DSC files, calculates onset and peak temperatures, and asks students to justify whether cold crystallization should be included in total crystallinity calculations for PET. That kind of guided online resource teaches both polymer science and analytical rigor. As a sub-pillar hub, this topic should point readers toward property databases, coding tutorials, standards references, and technique-specific guides so they can go deeper method by method.
Validate Results, Manage Risk, and Build a Repeatable Workflow
Validation is what separates a polished chart from a defensible polymer conclusion. Every online analysis result should be checked against a known reference, an independent calculation, or a physical expectation. If a semicrystalline polymer shows increasing tensile modulus while calculated crystallinity drops sharply, investigate before publishing the graph. If GPC suggests molecular weight doubled after multiple extrusion passes, review calibration, detector drift, and sample preparation because chain extension is not the default assumption. In online workflows, version control matters as much as chemistry. Save the raw file, the cleaned file, the script or parameter set, and the final plot. Cloud notebooks, ELNs, and shared drives make this easy when set up correctly. They also help with auditability in regulated or customer-facing environments, where a result must be reproducible months later.
There are real limitations to online tools. Large spectroscopy files may upload slowly. Proprietary vendor formats can restrict interoperability. Browser applications sometimes hide smoothing, interpolation, or peak-picking defaults that influence outcomes. Data security is another consideration, especially for commercial formulations and customer samples. For that reason, teams should review hosting terms, access controls, export options, and backup procedures before adopting any platform. Even with those caveats, the benefits are substantial when the workflow is structured. Use a consistent project template, define metadata fields, choose reference sources in advance, and document analytical assumptions near the plots, not in a separate memory-dependent conversation. Start simple: one cloud notebook for calculations, one database for benchmarks, and one shared repository for reports. Then expand toward dashboards and automated pipelines. The result is better polymer data analysis, better teaching, and faster decisions. Review your current workflow, identify one analysis step to move online this week, and build from there.
Frequently Asked Questions
1. What kinds of polymer data can online analysis tools handle?
Online polymer data analysis tools can support a wide range of experimental data, especially when they are designed for materials science, analytical chemistry, or engineering workflows. In practice, many browser-based platforms and cloud-enabled applications can process data from differential scanning calorimetry (DSC), gel permeation chromatography (GPC), dynamic mechanical analysis (DMA), Fourier transform infrared spectroscopy (FTIR), Raman spectroscopy, rheology, tensile testing, thermogravimetric analysis (TGA), and related characterization methods. These tools help turn raw signals, peak traces, stress-strain curves, frequency sweeps, and thermal transitions into meaningful outputs such as glass transition temperature, melting temperature, crystallinity estimates, molecular weight averages, viscoelastic moduli, degradation profiles, and mechanical performance metrics.
The exact capabilities depend on the platform. Some tools focus on general-purpose data cleaning, plotting, regression, and statistics, while others are built specifically for polymer workflows and include templates for common calculations. For example, a spectroscopy tool may support baseline correction, peak fitting, normalization, and spectral comparison, while a rheology platform may emphasize viscosity models, storage and loss modulus analysis, and time-temperature superposition. In tensile testing, online tools may calculate elastic modulus, yield strength, elongation at break, and toughness from uploaded instrument files or spreadsheets.
It is also increasingly common for online tools to support collaborative interpretation rather than just isolated calculation. That means multiple users can review the same polymer dataset, annotate transitions or anomalies, compare formulations, and generate publication-ready visuals without needing the same desktop software installation. Before choosing a tool, it is smart to confirm three things: whether it supports your instrument output format, whether it includes the analysis routines you need, and whether it preserves enough metadata to keep your results scientifically traceable.
2. How do you typically use an online tool for polymer data analysis from start to finish?
A typical workflow starts with exporting raw data from an instrument in a usable format such as CSV, TXT, XLSX, or a vendor-compatible file type. Once the data is uploaded to the online platform, the first step is usually inspection and cleanup. That may include checking units, verifying sample names, removing obvious artifacts, trimming irrelevant regions, aligning replicate runs, and making sure the data structure is consistent. Good online tools make this stage easier by offering previews, automated parsing, and error flags for missing values or unusual formatting.
After cleanup, the next step is applying the analysis method that matches the technique. In DSC, that might mean identifying glass transitions, crystallization peaks, and melting endotherms. In GPC, it could involve calibrating the chromatogram and calculating number-average and weight-average molecular weights along with dispersity. In DMA, the tool may help identify storage modulus, loss modulus, damping behavior, and transition temperatures across temperature or frequency ranges. In spectroscopy, common steps include baseline correction, smoothing, normalization, peak assignment, and multivariate comparison. For rheology or tensile testing, the workflow often includes selecting regions of interest, fitting models, and extracting material parameters from curves.
Once the calculations are complete, the online tool usually provides plots, tabulated results, and export options. This is where cloud-based platforms become especially useful: users can save processed datasets, compare samples side by side, share links with colleagues, and generate reports for research, quality control, or product development. The best practice is to document every processing step, including smoothing settings, integration limits, calibration choices, and any excluded data points. That way, the analysis remains reproducible and defensible, especially if the results are later used in publications, compliance documentation, or engineering decisions.
3. What should you look for when choosing an online tool for polymer data analysis?
The most important consideration is fit for purpose. A strong online polymer data analysis tool should match both your data type and your technical goals. If you mainly work with thermal analysis, the software should make it easy to detect transitions, integrate peaks, compare heating and cooling cycles, and manage replicate experiments. If your work centers on molecular characterization, you may need chromatographic calibration support, molecular weight calculations, and distribution plotting. If you are focused on mechanics or rheology, model fitting, viscoelastic analysis, and clear curve visualization are often more important than broad multi-technique compatibility.
Usability also matters more than many people expect. A tool can be mathematically powerful but still slow down your work if importing files is difficult, plots are hard to customize, or collaboration features are limited. Look for an interface that supports straightforward uploads, transparent settings, interactive graphs, and clear export options. Version history, shared workspaces, and annotation features are especially valuable for research groups and engineering teams that need to review results collectively. Strong documentation, tutorials, and support resources are another sign that a platform is practical for regular use rather than just occasional experimentation.
Just as important are scientific reliability and data governance. The platform should allow you to see how calculations are performed, preserve metadata, and maintain auditability. If the tool is cloud-based, review its data security practices, user permissions, encryption standards, and storage policies, particularly if you handle proprietary formulations or regulated project data. Finally, consider scalability. A good choice should not only solve today’s analysis problem, but also support larger datasets, routine workflows, and cross-team collaboration as your polymer characterization needs grow.
4. Are online polymer data analysis tools accurate enough for research and engineering work?
Yes, online tools can be accurate enough for serious research, development, and engineering use, but accuracy depends less on whether the tool is online and more on how well the method is implemented and how carefully the user handles the data. A browser-based platform can perform the same core mathematical operations as desktop software, including curve fitting, baseline correction, integration, smoothing, interpolation, calibration, and statistical analysis. If those algorithms are sound and the workflow is transparent, the results can be highly reliable.
That said, polymer data analysis always involves judgment. Small choices can affect final values: where a baseline is drawn in DSC, which calibration standards are used in GPC, how noise is filtered in spectroscopy, or what strain range is selected when calculating tensile modulus. Online tools are only as trustworthy as the methods they support and the user decisions made during processing. For that reason, good practice includes validating the tool with known reference materials, comparing a subset of results against trusted desktop software or manual calculations, and checking whether outputs remain consistent across replicate samples.
For high-stakes work, such as product qualification, regulatory documentation, or published research, it is wise to establish a validation routine. That may include standard operating procedures, approved parameter settings, documented calibration practices, and periodic cross-checks by another analyst. Online tools are especially valuable when they make these steps easier through shared templates, recorded workflows, and centralized data access. In other words, online analysis can absolutely meet professional standards, provided it is used within a disciplined, reproducible framework.
5. What are the biggest advantages of using online tools for polymer data analysis?
The biggest advantage is accessibility. Online tools allow students, researchers, and engineers to analyze polymer data from virtually anywhere without depending on a single licensed workstation or a lab-specific desktop setup. That can dramatically reduce delays, especially when teams are distributed across locations or when rapid interpretation is needed after experiments. Instead of emailing files back and forth or waiting for access to specialized software, users can upload data, review plots, and share findings through a browser-based environment.
Another major benefit is collaboration. Polymer analysis often involves more than one perspective: an instrument specialist may understand the raw signal, a polymer scientist may interpret thermal or molecular behavior, and a product engineer may need the final material property for design decisions. Online platforms can bring those roles together by supporting shared datasets, comments, side-by-side comparisons, and synchronized reporting. This reduces miscommunication and makes it easier to track why a sample was accepted, rejected, or flagged for retesting.
Efficiency is the third key advantage. Many online tools streamline repetitive work through templates, automated calculations, standardized plots, and reusable workflows. That helps improve consistency across experiments and across team members. In addition, cloud-based environments often make it easier to organize historical datasets, compare batches, and build a more searchable knowledge base around polymer performance. When chosen carefully and used correctly, online polymer data analysis tools do more than save time. They help create faster, more transparent, and more scalable workflows for turning complex experimental measurements into actionable material insight.