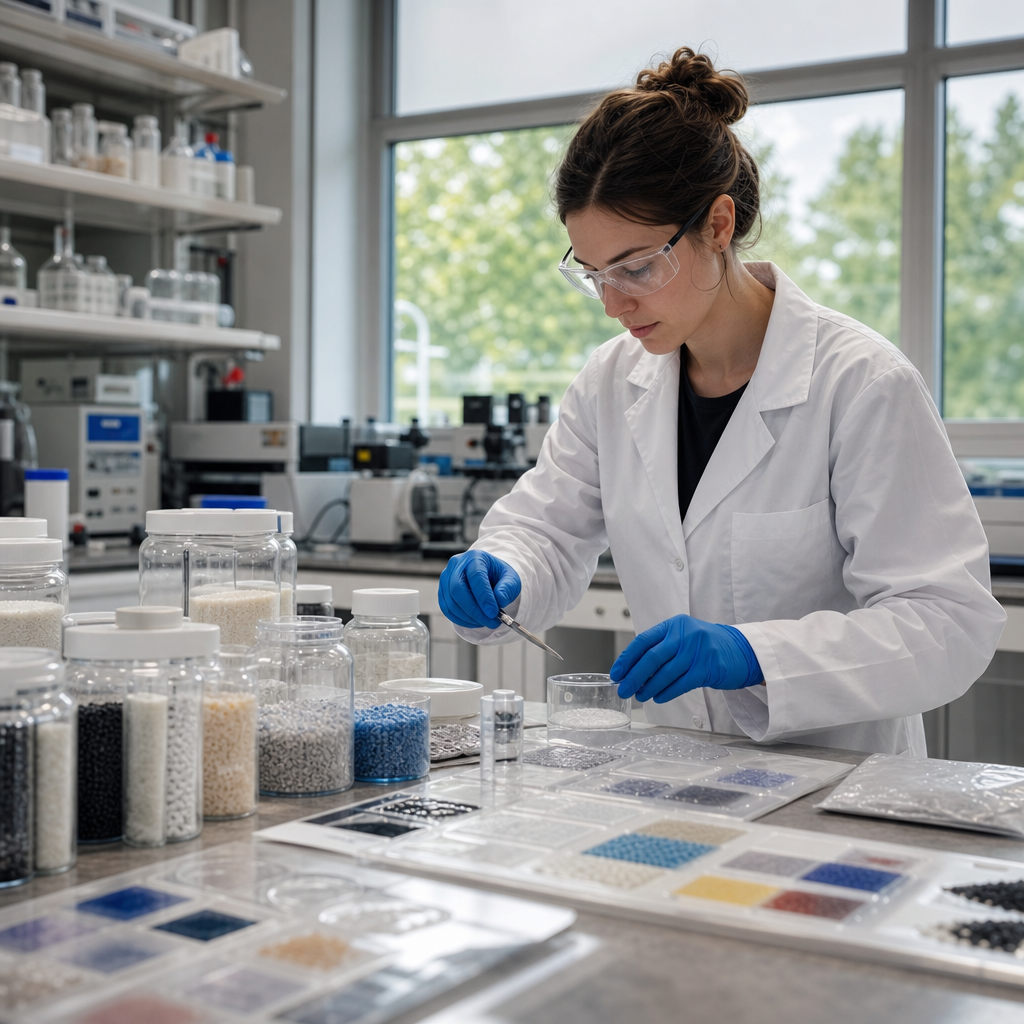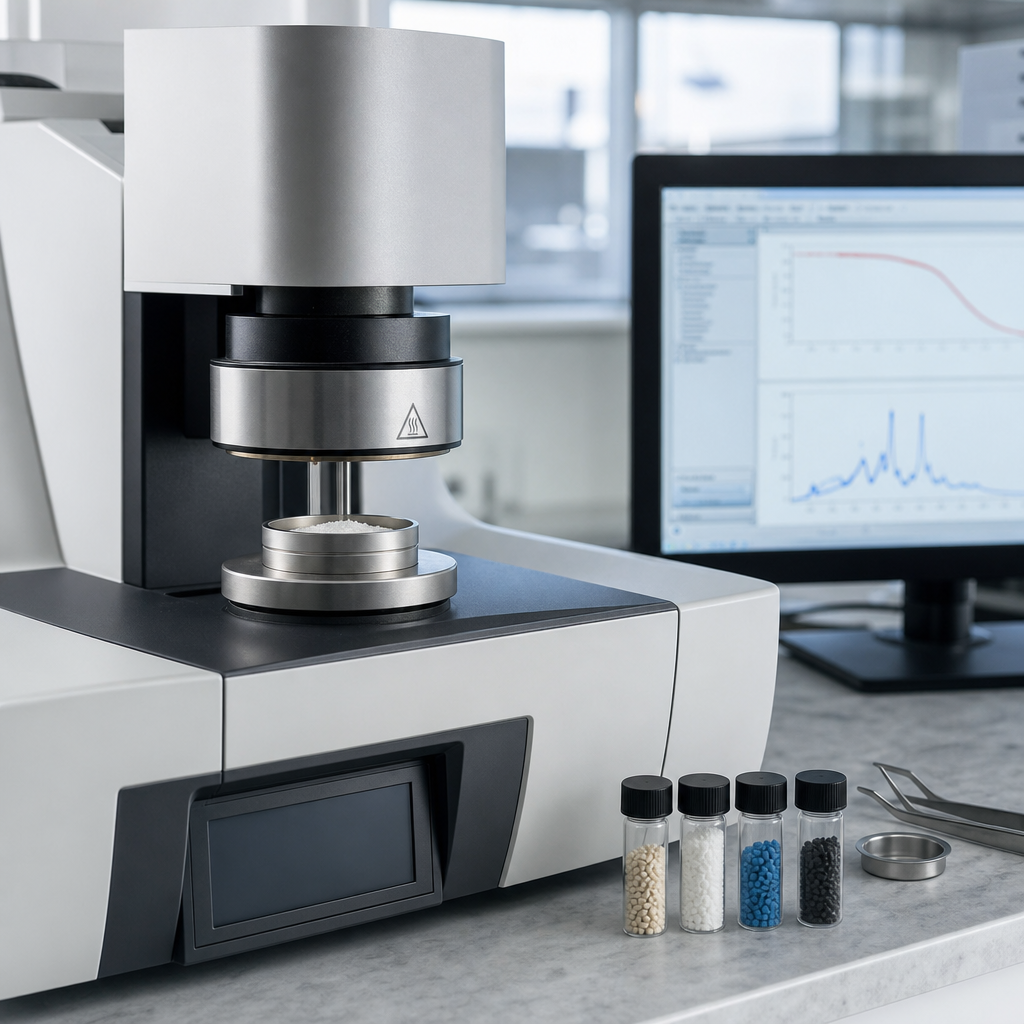
Thermal analysis of polymers is the controlled measurement of how a polymer responds to heat, cooling, or constant temperature over time. In practice, that means tracking transitions such as glass transition, melting, crystallization, oxidation, decomposition, and dimensional change so you can understand how a material will process, perform, and fail. I have used thermal analysis to compare incoming resin lots, troubleshoot warped molded parts, verify cure in thermosets, and screen recycled content for hidden variability. When done correctly, it turns a vague question like “Why did this part crack?” into a specific answer tied to temperature history, crystallinity, residual volatiles, or thermal stability.
For polymer engineers, lab technicians, product designers, and students, thermal analysis matters because polymers are unusually sensitive to temperature. A ten-degree shift in molding temperature can change crystallinity, shrinkage, impact strength, and barrier performance. A small amount of absorbed moisture can create an extra mass-loss step in a thermogravimetric curve and alter processing behavior. A slightly incomplete cure in an epoxy can lower the glass transition temperature enough to cause creep in service. Thermal analysis provides the evidence behind those changes and helps connect structure, processing, and properties.
This guide explains how to perform thermal analysis of polymers as a practical workflow rather than a list of instrument definitions. It covers the core methods used in most materials laboratories: differential scanning calorimetry, thermogravimetric analysis, dynamic mechanical analysis, thermomechanical analysis, and dielectric analysis where relevant for curing systems. It also explains sample preparation, atmosphere selection, heating rates, calibration, baseline quality, and data interpretation. As a hub for tutorials and guides, this article is designed to help you choose the right test, run it correctly, and understand what the results actually mean for polymer development, quality control, failure analysis, and regulatory documentation.
Before testing, define the decision you need to make. Are you identifying an unknown polymer, checking lot-to-lot consistency, setting a drying condition, validating a molding window, confirming cure, estimating service temperature, or diagnosing degradation? The objective determines the instrument, temperature program, sample mass, pan type, purge gas, and acceptance criteria. Thermal analysis is not one test but a family of methods, and the biggest mistakes usually happen before the sample ever enters the furnace: poor sampling, contamination, mismatched reference pans, or asking a technique to answer a question it cannot answer alone.
Choose the right thermal analysis method for the polymer question
The fastest way to improve polymer thermal analysis is to match the method to the question. Differential scanning calorimetry, usually called DSC, measures heat flow into or out of a sample. Use it to find glass transition temperature, melting point, crystallization temperature, oxidation induction time, and enthalpy changes related to cure or crystallinity. Thermogravimetric analysis, or TGA, measures mass change versus temperature or time. Use it to quantify moisture, solvent residue, plasticizer loss, filler loading, ash, carbon black, decomposition onset, and thermal stability in inert or oxidative atmospheres.
Dynamic mechanical analysis, DMA, measures viscoelastic properties such as storage modulus, loss modulus, and tan delta as temperature, time, or frequency changes. It is often the most sensitive method for glass transition and is especially useful when DSC shows only a weak transition, as with highly crosslinked systems or filled compounds. Thermomechanical analysis, TMA, tracks dimensional change under a small load and helps measure softening, expansion coefficient, shrinkage, and transition behavior in films, fibers, and molded parts. For curing thermosets and some adhesive systems, dielectric analysis can monitor ion viscosity and cure progression during processing.
| Question | Best method | Typical output | Common polymer example |
|---|---|---|---|
| What is the glass transition? | DSC or DMA | Tg, heat capacity shift, tan delta peak | Amorphous PETG, epoxy, ABS |
| How much crystallinity is present? | DSC | Melting and crystallization enthalpy | PE, PP, POM, PA6 |
| How much moisture or filler is in the sample? | TGA | Mass-loss steps, residue percent | Nylon with moisture, filled PP |
| Will the material hold stiffness near service temperature? | DMA | Storage modulus versus temperature | TPE seals, structural adhesive |
| Is cure complete? | DSC, DMA, dielectric analysis | Residual exotherm, Tg shift, cure profile | Epoxy, unsaturated polyester |
| How much does the part expand with heat? | TMA | Coefficient of thermal expansion | Electronic housing polymer |
In real projects, methods are often combined. If a polypropylene part warps after molding, DSC can reveal differences in crystallinity across regions, while TMA can quantify expansion behavior and TGA can check whether regrind introduced contamination. If a nylon connector becomes brittle, TGA can show moisture or additive loss, DSC can show altered crystallization, and DMA can reveal whether stiffness changed across the service temperature range. The most reliable interpretations come from converging evidence, not a single curve viewed in isolation.
Prepare polymer samples correctly before running the test
Sample preparation determines data quality more than many operators realize. Use a representative sample taken from the region tied to the question: gate versus end-of-fill in an injection molded plaque, skin versus core in a thick extrudate, printed bead versus bulk in additive manufacturing, or failed zone versus unaffected zone in a returned part. Cut cleanly with a sharp blade, microtome, or punch to minimize heating and deformation. For DSC and TGA, small masses are standard, often around 5 to 15 mg depending on the instrument and the expected event size. For DMA and TMA, geometry and dimensions must meet the fixture requirements.
Keep contamination under control. Oils from gloves, paper fibers, release agents, dust, and metal fragments can distort baselines or create false transitions. Dry hygroscopic polymers such as polyamide, PET, PBT, TPU, and PLA when the method requires a dry-state comparison, but document whether you are testing as-received, conditioned, or dried material because moisture itself may be the variable of interest. I have seen operators accidentally “solve” a customer complaint by drying all samples before TGA, thereby erasing the very moisture difference that caused splay and brittleness in production.
Container selection also matters. In DSC, hermetic pans help retain volatiles and are useful for low-boiling components or moisture studies, while vented or standard aluminum pans are often better for general transition analysis. High-pressure pans may be necessary for reactive systems. In TGA, open pans are common, but pan material must tolerate the temperature and chemistry of the run. For DMA, check that the clamp mode matches the sample form: tensile for films and fibers, dual cantilever or three-point bending for rigid bars, compression for foams or elastomers. Good thermal contact, correct alignment, and consistent dimensions are basic requirements, not optional refinements.
Set instrument conditions, calibration, and atmosphere with intent
A polymer thermal analysis method is only meaningful when the temperature program and atmosphere reflect the material question. Heating rate is one of the most influential settings. Faster rates shift transitions to higher apparent temperatures and can smear overlapping events; slower rates improve separation and approach equilibrium but take more time and may allow oxidation if purge quality is poor. A common DSC screening rate is 10 degrees Celsius per minute, but semicrystalline polymers sometimes benefit from a heat-cool-heat cycle, while cure studies may require isothermal holds or multiple ramps. In TGA, 10 to 20 degrees per minute is common, but decomposition mechanisms can change with rate.
Atmosphere selection changes the interpretation. Nitrogen or argon suppress oxidation and are preferred for studying intrinsic transitions and pyrolytic stability. Air or oxygen reveals oxidative stability and combustion behavior. Oxidation induction time testing for polyolefins, for example, commonly heats the sample under nitrogen to a set temperature and then switches to oxygen while timing the onset of exothermic oxidation. That result is directly relevant for antioxidant package evaluation in polyethylene pipes, polypropylene caps, and cable insulation, where thermal aging resistance matters.
Calibration is not paperwork; it is part of the measurement. DSC temperature and enthalpy calibration commonly use standards such as indium, tin, or zinc with known melting points and heats of fusion. TGA mass calibration and buoyancy checks prevent drift that can look like false mass loss. DMA requires fixture calibration, force validation, and attention to frequency settings. Baseline runs with empty pans or references show whether purge flow, sensor condition, or furnace contamination is affecting the signal. In any laboratory I have managed, unusual polymer results are never released until the operator checks calibration status, baseline quality, and whether the pan or fixture choice was appropriate.
Run and interpret DSC for glass transition, melting, crystallization, and cure
DSC is often the first thermal test performed on polymers because it quickly reveals major transitions. For amorphous polymers, the key event is usually the glass transition, seen as a step change in heat capacity. For semicrystalline polymers, you may also observe cold crystallization, crystallization on cooling, and melting on reheating. A standard approach is heat-cool-heat: the first heating records thermal history from processing, the controlled cooling shows crystallization behavior, and the second heating reflects the material after standardized thermal conditioning. This sequence is especially valuable for polyethylene terephthalate, polypropylene, polyethylene, polyamide, and polyoxymethylene.
Interpreting DSC requires context. A higher melting peak does not automatically mean “better” material. In polypropylene, a higher melting enthalpy may indicate higher crystallinity, which can improve stiffness and chemical resistance but increase shrinkage and reduce impact performance. In PLA, cold crystallization during heating may reveal that the molded article was quenched into a low-crystallinity state. In PET, a broad glass transition with enthalpic relaxation can indicate physical aging. In epoxy systems, a residual exotherm on first heating means cure is incomplete; the area under that exotherm can be compared with total cure enthalpy to estimate degree of cure.
For crystallinity calculations, use the measured heat of fusion corrected for cold crystallization where applicable, then divide by the reference heat of fusion for a 100 percent crystalline polymer. For example, isotactic polypropylene is often referenced near 207 J/g, though values can vary by source and crystal form assumptions. State the reference clearly in your report. Be cautious with blends, copolymers, nucleated grades, and filled systems because overlapping peaks and nonpolymer mass can distort the apparent result. When reporting Tg, define the method used, such as midpoint, inflection, or onset, because different software defaults can shift values by several degrees.
Use TGA, DMA, and TMA to answer stability and performance questions
TGA is the workhorse for composition and stability. A simple mass-loss curve can identify free moisture below about 150 degrees Celsius, plasticizer or processing oil loss at intermediate temperatures, and polymer decomposition at higher temperatures. Filled compounds leave residue that can quantify glass fiber, mineral filler, titanium dioxide, or ash. With a programmed atmosphere change from nitrogen to air, carbon black can be separated from inorganic ash because the carbon oxidizes while mineral filler remains. This is widely used in quality control for black polyethylene pipe compounds and conductive polymer formulations.
Derivative thermogravimetry, the rate-of-mass-loss curve, helps resolve overlapping decomposition steps. That matters in multicomponent materials such as flame-retarded ABS, plasticized PVC, wood-polymer composites, or recycled blends containing unknown contamination. For instance, PVC often shows an early dehydrochlorination step followed by backbone degradation, while polyamide may show moisture loss before main decomposition. TGA does not identify chemistry by itself, but paired with evolved gas analysis by FTIR or mass spectrometry, it becomes much more diagnostic. If you suspect a lubricant, residual solvent, or decomposition byproduct, coupling techniques can confirm what the mass-loss event represents.
DMA and TMA connect thermal events to real mechanical behavior. DMA shows where a polymer stops behaving like a rigid solid and begins to lose load-bearing ability. The storage modulus drop through Tg is often the clearest indicator of useful service temperature, especially for adhesives, composites, and elastomeric parts. A structural epoxy may retain modulus well below Tg but soften rapidly as temperature approaches it. TMA complements that picture by measuring dimensional change and coefficient of thermal expansion. In electronics housings, under-hood automotive parts, and optical assemblies, expansion mismatch can cause stress, seal failure, or warpage even when the polymer itself does not melt or decompose.
Build a repeatable workflow and turn curves into decisions
A reliable polymer thermal analysis workflow starts with a written test plan and ends with a decision tied to product risk. Record material identity, lot number, conditioning history, sample location, sample mass, pan or fixture type, purge gas, flow rate, heating rate, temperature range, calibration date, and analysis method. Run duplicates when the result will drive release or rejection, and triplicates when the material is heterogeneous or recycled. Compare unknowns against a retained control, not memory. In quality investigations, always ask whether the curve shift exceeds normal method variation before concluding that the resin changed.
Interpret results in the language of manufacturing and performance. Do not stop at “Tg decreased by 8 degrees.” Explain that the adhesive may soften earlier in summer service, or that an under-cured composite panel may not meet dimensional stability targets after paint bake. Do not report “mass loss at 110 degrees” without adding that it likely reflects absorbed moisture and therefore points to inadequate drying before molding. Thermal analysis is most useful when it informs an action: adjust barrel temperatures, extend dryer residence time, change post-cure schedule, tighten regrind limits, qualify a new supplier, or launch deeper spectroscopy and microscopy work.
As the hub for tutorials and guides within Educational Resources, this page should anchor your broader learning path on polymer testing. Start with the method that matches the decision, prepare representative samples carefully, control atmosphere and heating rate, calibrate routinely, and interpret every curve in the context of polymer chemistry and process history. DSC answers transition and cure questions, TGA quantifies stability and composition, DMA reveals functional stiffness, and TMA exposes thermal movement. Used together, these tools reduce guesswork and make material decisions defensible. Apply this workflow to your next polymer problem, document it well, and build a reference library of curves your team can trust.
Frequently Asked Questions
1. What is thermal analysis of polymers, and why is it important?
Thermal analysis of polymers is the systematic measurement of how a polymer changes when it is heated, cooled, or held at a constant temperature over time. The goal is to identify key thermal events and stability limits that directly affect processing, performance, quality, and service life. In practical terms, thermal analysis helps you detect transitions such as the glass transition temperature (Tg), melting point, crystallization behavior, oxidation onset, thermal degradation, cure reactions, and dimensional changes. These measurements are essential because polymers are highly temperature-sensitive materials, and even small differences in thermal behavior can lead to major differences in molding, extrusion, bonding, storage stability, or end-use durability.
In manufacturing and materials engineering, thermal analysis is often used to compare incoming resin lots, verify whether a thermoset is fully cured, troubleshoot warped or brittle molded parts, assess the effect of fillers or plasticizers, and evaluate recycled content or contamination. It also supports failure analysis by showing whether a material was exposed to excessive heat, oxidized prematurely, or lost crystallinity during processing. Instead of relying only on visual inspection or mechanical testing, thermal analysis provides direct evidence of what the polymer is doing internally as temperature changes. That makes it one of the most reliable ways to connect material structure with real-world processing and product behavior.
2. Which thermal analysis techniques are most commonly used for polymers?
The most common thermal analysis techniques for polymers are Differential Scanning Calorimetry (DSC), Thermogravimetric Analysis (TGA), Dynamic Mechanical Analysis (DMA), Thermomechanical Analysis (TMA), and, in many workflows, Differential Thermal Analysis (DTA) or evolved gas techniques used alongside TGA. Each method reveals a different aspect of polymer behavior, so the best choice depends on the question you are trying to answer.
DSC is widely used to measure heat flow associated with thermal transitions. It is the primary tool for identifying glass transition, melting, crystallization, cold crystallization, oxidation induction behavior, and cure reactions in thermosets. If you need to know whether a material is semicrystalline, how much crystallinity it has, whether a resin lot is consistent, or whether a crosslinking reaction is complete, DSC is usually the first technique to consider. TGA measures mass change as a function of temperature or time, making it especially useful for studying thermal stability, decomposition, moisture loss, solvent residue, plasticizer volatilization, filler content, ash content, and oxidation-related weight changes. If you want to know when a polymer starts to break down or how much inorganic reinforcement it contains, TGA is the right tool.
DMA measures stiffness and damping as temperature, frequency, or time changes. It is especially valuable for detecting Tg with high sensitivity and for understanding viscoelastic performance under conditions closer to actual use. TMA tracks dimensional changes under controlled load and temperature, which helps evaluate softening, shrinkage, thermal expansion, and distortion behavior. That is useful when investigating warped parts or dimensional instability. In many advanced investigations, these techniques are not used in isolation. A DSC curve may show a melting event, while TGA confirms whether there is concurrent degradation, and DMA may reveal how that transition affects modulus. Together, they provide a far more complete picture of polymer behavior than any single test alone.
3. How do you perform thermal analysis of polymers correctly?
Performing thermal analysis correctly starts with defining the purpose of the test. Before selecting an instrument or running a method, determine whether you are trying to measure Tg, melting behavior, oxidation resistance, decomposition temperature, cure state, crystallinity, filler level, or dimensional change. Once the objective is clear, choose the technique that best matches it and set test conditions that reflect the material and the application. For example, DSC is ideal for thermal transitions and cure, TGA for weight loss and stability, DMA for viscoelastic transitions, and TMA for expansion and softening.
Sample preparation is critical. Use a representative sample, keep the mass within the recommended range for the instrument, and avoid contamination from dust, oils, or mixed materials unless the purpose is contamination screening. The sample should also be prepared in a way that reflects the material form you want to evaluate. A pellet, molded plaque, thin film, fiber, or powdered regrind may produce different results because thermal history and orientation matter. In DSC, even prior cooling rate or molding conditions can influence crystallinity and transition shape. In TGA, surface area and sample mass can affect decomposition profiles. Proper pan selection, sealing method, atmosphere choice, and loading technique all matter.
Method setup is equally important. Select an appropriate heating or cooling rate, temperature range, purge gas, and hold times. Nitrogen is often used to study intrinsic thermal transitions without oxidation, while air or oxygen may be used when oxidation stability is the focus. A fast heating rate can shift peaks and reduce resolution, while a slower rate often improves separation of events but increases test time. Calibration should be current, and baseline checks should be routine. For polymers with complex history, it is common to use multiple scans, such as a first heat to observe as-received condition, controlled cooling to standardize morphology, and second heat to evaluate inherent material behavior with reduced processing history effects.
Interpretation should always consider both the data and the material context. A broad Tg may indicate a blend, plasticization, or heterogeneity. A lower-than-expected melting peak may suggest degraded molecular weight or altered crystal structure. An exotherm in a thermoset may indicate incomplete cure. Unexpected TGA residue may signal mineral filler, pigment, flame retardant, or contamination. Good practice also includes comparing results to known references, technical datasheets, historical lot data, and companion tests such as FTIR, density, rheology, or microscopy when needed. In short, correct thermal analysis is not just running the instrument; it is designing the test so the result answers a real materials question with confidence.
4. What polymer properties and transitions can thermal analysis reveal?
Thermal analysis can reveal a broad range of polymer properties and transitions that are directly tied to processability and end-use performance. One of the most important is the glass transition temperature, where an amorphous polymer or the amorphous phase of a semicrystalline polymer changes from a hard, glassy state to a softer, more mobile state. This transition influences stiffness, impact behavior, dimensional stability, and service temperature. For semicrystalline polymers, thermal analysis can also show melting behavior and crystallization behavior, which affect shrinkage, warpage, clarity, barrier performance, mechanical strength, and molding cycle efficiency.
Thermal methods also reveal oxidation resistance and thermal stability. Oxidation induction testing can help estimate how well a stabilized polymer resists oxidative attack, which matters in long-term heat exposure applications. TGA can show the onset of decomposition, multi-step degradation pathways, moisture or solvent loss, and the amount of nonvolatile residue remaining after burnout. That makes it useful for identifying additives, estimating filler content, and distinguishing between neat resin and compounded material. In thermosets, DSC can reveal residual cure or cure exotherms, helping determine whether crosslinking is complete. In elastomers and adhesive systems, DMA can characterize viscoelastic response over temperature and frequency, which is often more meaningful than a single static property.
Dimensional behavior is another important area. TMA can measure coefficient of thermal expansion, softening behavior, and shrinkage or expansion under load. This is especially helpful in diagnosing warped components, fit-up issues, or thermal mismatch in assemblies. More broadly, thermal analysis can provide insight into blend compatibility, recycled content consistency, lot-to-lot variation, and processing history. For example, a shift in Tg, a change in melting enthalpy, or a new low-temperature weight-loss step can indicate contamination, plasticizer differences, or altered morphology. Because polymer structure, additives, and thermal history all influence the response, thermal analysis acts as a practical window into the material’s internal state.
5. How do you interpret thermal analysis results when troubleshooting polymer processing or quality problems?
Interpreting thermal analysis results for troubleshooting requires looking beyond individual numbers and asking how the full thermal profile compares with what the material should look like. Start by comparing suspect material to a known-good control tested under the same conditions. That side-by-side comparison is often more informative than interpreting an isolated curve. If a molded part is warping, for example, DSC may show a different crystallization temperature or crystallinity level than the control, indicating a cooling-rate or processing-history issue. If a part is brittle, a higher-than-expected Tg, lower plasticizer content, oxidative damage, or incomplete fusion may be contributing factors. If a thermoset underperforms, a residual cure exotherm may show that the cure schedule was insufficient.
In TGA troubleshooting, an early weight-loss step may point to residual moisture, volatiles, or contamination. A lower decomposition onset than expected can indicate polymer degradation, poor stabilization, or the presence of lower molecular weight material. Residue differences may reveal filler loading changes, recycled content variation, or lot-to-lot compounding inconsistency. In DMA, a shift in modulus or damping peak can signal changes in crosslink density, phase morphology, or blend composition. In TMA, excessive thermal expansion or softening under load