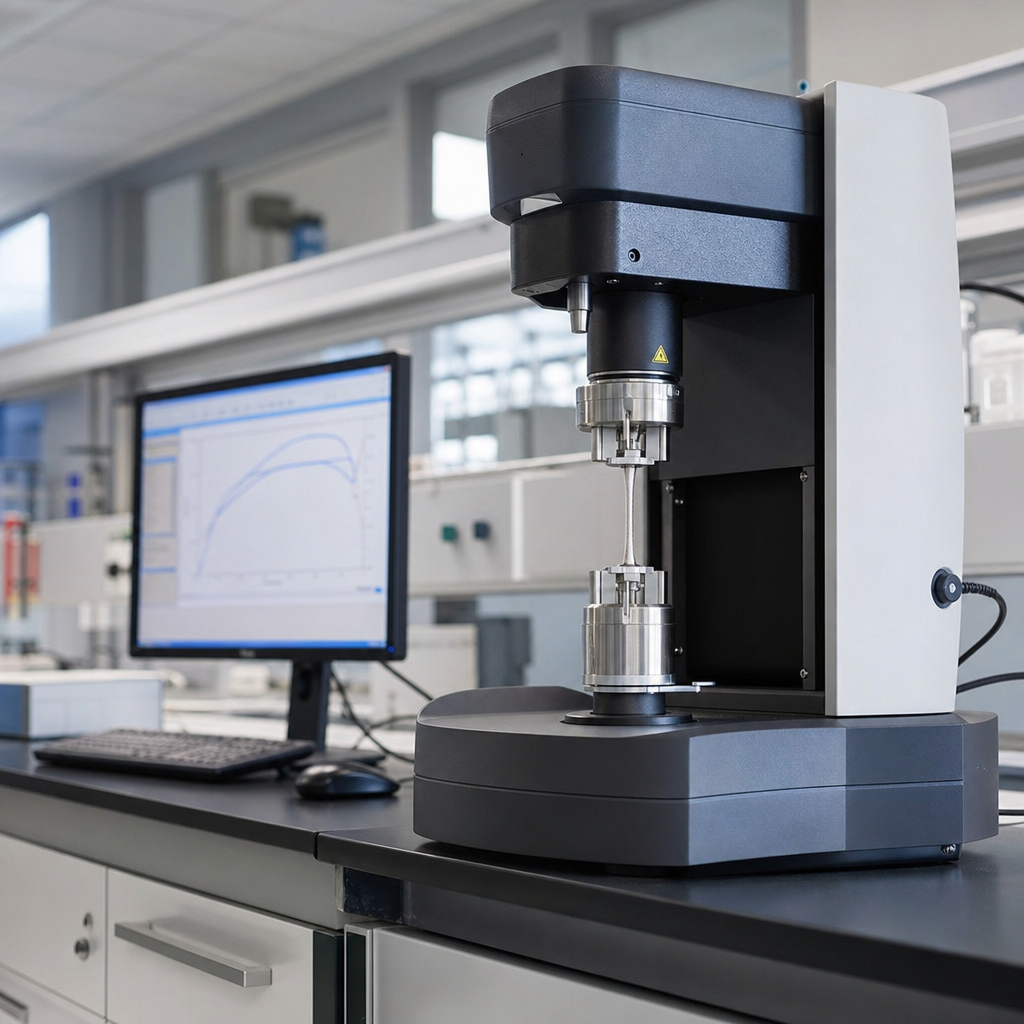
Dynamic mechanical analysis, usually shortened to DMA, is one of the most practical methods for measuring how a material responds to force as temperature, time, and frequency change. In a single experiment, DMA reveals stiffness, damping, transitions, and viscoelastic behavior that tensile strength or hardness tests alone cannot show. For engineers working with polymers, adhesives, composites, films, foams, biomaterials, and coatings, DMA is often the fastest route to understanding whether a formulation will hold shape, absorb vibration, creep under load, or fail in service.
At its core, DMA applies a controlled oscillating stress or strain to a specimen and measures the resulting strain or stress response. Because real materials are not perfectly elastic, the response lags behind the input. That lag is expressed as phase angle and broken into storage modulus, loss modulus, and tan delta. Storage modulus represents the energy stored and recovered each cycle, so it tracks stiffness. Loss modulus represents energy dissipated as heat, so it tracks molecular motion and damping. Tan delta, the ratio of loss to storage modulus, is a convenient indicator of transitions such as the glass transition temperature, often called Tg.
This matters because product performance is rarely static. A pressure-sensitive adhesive on a label, a carbon-fiber epoxy bracket in an aircraft interior, a thermoplastic clip under a car hood, and a medical catheter stored in cold distribution all experience changing temperatures and loading rates. I have used DMA to resolve problems that looked unrelated in the field but shared the same root cause in the viscoelastic spectrum: a seal that softened near service temperature, a coating that cracked after cold shipment, and an overmolded part that buzzed at one frequency band. DMA turned vague complaints into measurable design inputs.
As a hub article for tutorials and guides, this page explains how to perform dynamic mechanical analysis step by step, what each setting means, how to prepare samples, how to interpret the curves, and where beginners typically make mistakes. It also points you toward the practical questions every searcher asks: what does DMA measure, how do you choose mode and fixture, what temperature ramp is appropriate, how do you identify Tg, and how do you know whether the data are valid. If you need a reliable process rather than a textbook overview, start here.
Understand the DMA method before touching the instrument
A DMA instrument combines a force generator, displacement sensor, furnace or environmental chamber, and interchangeable fixtures. Commercial systems from TA Instruments, Netzsch, Mettler Toledo, and PerkinElmer differ in drive design and control architecture, but the workflow is similar. You mount a specimen, choose a deformation mode, define amplitude, frequency, preload, and temperature program, then run the test while the software records modulus and damping. The most common modes are dual cantilever, single cantilever, three-point bending, tension, compression, and shear. Each mode changes the stress distribution, so mode selection is not a convenience setting; it determines whether the result is physically meaningful.
Before running any method, define the question the test must answer. If the goal is to identify Tg of an amorphous polymer, a temperature sweep in bending or tension at 1 hertz may be enough. If the goal is to compare damping between elastomer compounds across engine vibration frequencies, use a frequency sweep at several temperatures and apply time-temperature superposition if the material is thermorheologically simple. If the goal is to screen cure progression in a thermoset, track the rise in storage modulus during an isothermal hold. Good DMA starts with a service-relevant question and then builds a method that reproduces the loading and thermal conditions that matter.
Units and terminology also matter. Storage modulus is reported as E’ in tension or bending, G’ in shear, and sometimes K’ in compression depending on geometry and vendor notation. Loss modulus is E” or G”. Tan delta equals E” divided by E’. Phase angle, delta, is the lag between applied and measured sinusoidal signals. In polymer development, Tg may be quoted from the onset drop in E’, the peak of E”, or the peak of tan delta. Those values are not interchangeable, and a report that fails to state the chosen criterion is incomplete.
Prepare the sample, fixture, and method correctly
Most bad DMA data come from sample preparation and setup, not from the instrument. The specimen must have accurate dimensions, uniform thickness, smooth edges, and a geometry suited to the selected clamp. Thin films can wrinkle in tension if grips are misaligned. Brittle bars can fracture during mounting if the preload is too high. Soft foams can buckle in compression if the aspect ratio is poor. When I train new users, I insist they measure width and thickness with calibrated tools at multiple points and record the average, because modulus calculations are sensitive to geometry errors. A five percent thickness error can easily become a larger modulus error depending on the mode.
Condition the sample before testing when moisture or thermal history affects behavior. Nylon, for example, shows major modulus changes with humidity. Semi-crystalline polymers can retain molded-in stress that shifts transition behavior. Adhesives may continue to post-cure after lamination. If your material specification references ASTM or ISO methods, follow the conditioning requirements exactly. Common standards include ASTM D4065 for plastics dynamic mechanical properties and ASTM D7028 for glass transition by DMA in polymer matrix composites. Standards do not replace judgment, but they create comparability across labs.
The practical setup sequence is straightforward when done carefully. Choose the fixture that matches specimen form and intended deformation. Verify the fixture is clean and undamaged. Perform instrument calibration for force, displacement, and temperature as required by the manufacturer. Mount the sample with minimal induced stress and correct span length. Apply only enough preload to maintain contact. Run an amplitude sweep first if the linear viscoelastic region is unknown. In that region, modulus should stay essentially constant as strain amplitude changes. Testing outside it can generate apparent softening caused by nonlinear response rather than true material transitions.
| Decision point | Best practice | Why it matters |
|---|---|---|
| Fixture selection | Use tension for films, bending for rigid bars, compression for foams, shear for adhesives when possible | Wrong mode distorts stress distribution and can mask real transitions |
| Amplitude | Confirm linear viscoelastic region with a strain or stress sweep | Prevents nonlinear artifacts and false modulus loss |
| Frequency | Start at 1 Hz for screening, then expand to application-relevant frequencies | Viscoelastic properties are rate dependent |
| Temperature ramp | Commonly 2 to 5 degrees Celsius per minute for transition work | Ramps that are too fast shift peaks and increase thermal lag |
| Atmosphere | Use nitrogen when oxidation or thermal degradation is a risk | Protects samples during high-temperature sweeps |
Run the core DMA experiments: temperature, frequency, time, and cure sweeps
The most common DMA procedure is the temperature sweep. You hold frequency and amplitude constant while ramping temperature and tracking E’, E”, and tan delta. For a typical amorphous thermoplastic, E’ is high in the glassy region, drops sharply through Tg, and levels into the rubbery region. E” often shows a distinct peak near molecular relaxation, while tan delta broadens and peaks slightly differently. A practical example is polycarbonate: in the glassy state it is rigid, but as it approaches Tg the modulus decline signals why snap-fits lose retention and parts become dimensionally unstable. A temperature sweep makes that change visible long before a simple room-temperature tensile test would.
Frequency sweeps answer a different question: how the material responds when loading rate changes. For elastomers and damping materials, this is critical because a seal compressed slowly behaves differently from the same seal vibrating at 50 hertz. In a frequency sweep, keep strain small and temperature fixed, then vary frequency across the instrument’s reliable range. Higher frequency generally increases storage modulus because polymer chains have less time to rearrange. If the curves are smooth and the material is suitable, you can build master curves using time-temperature superposition and estimate long-term or high-frequency behavior beyond direct test limits.
Time sweeps and isothermal holds are especially useful for cure studies, physical aging, stress relaxation, and stability checks. In a thermoset resin, storage modulus rises as crosslink density builds. In a hot-melt adhesive, modulus may decay during a hold if the structure relaxes or if thermal degradation begins. For manufacturing support, I often pair an isothermal DMA cure run with DSC data. DSC shows reaction heat, while DMA shows when the part actually gains usable stiffness. Those are related but not identical endpoints, and process engineers usually care more about stiffness development than calorimetric completion alone.
Multifrequency temperature sweeps combine both dimensions and are widely used in research and advanced troubleshooting. They take longer and demand better instrument control, but they reveal whether transitions move with frequency as expected for viscoelastic relaxations. If a peak does not shift logically, investigate clamp slip, resonance, poor thermal equilibration, or material heterogeneity. Good DMA data are internally consistent. The shape of E’, E”, and tan delta should make physical sense together, not merely look smooth on a graph.
Interpret DMA results without common mistakes
The first rule of interpretation is to read all three curves together. A tan delta peak alone is not enough. Storage modulus shows where stiffness starts to fall, loss modulus highlights active molecular motion, and tan delta emphasizes damping. Depending on your application, the “correct” Tg may be the onset in E’, the E” peak, or the tan delta peak. For structural composites, designers often focus on the onset of modulus loss because that is where load-bearing capability begins to change. For vibration damping compounds, the tan delta peak may be more relevant because it marks maximum energy dissipation.
Another common mistake is comparing absolute modulus values from different fixtures or geometries as though they were identical. A molded bar in dual cantilever and a thin film in tension may both be the same polymer, yet the measured values and transition sharpness can differ because orientation, residual stress, and clamp mechanics differ. Compare like with like whenever possible: same specimen geometry, same fixture, same frequency, same ramp, same conditioning, and same Tg criterion. If one variable changes, document it and explain why. DMA is powerful, but it is not immune to method dependence.
Watch for artifacts. Clamp slip often appears as sudden drops in modulus or noisy tan delta spikes. Sample softening beyond fixture capability can cause sagging in bending. Resonance can distort high-frequency data. Thermal lag can shift peaks when thick samples are heated too quickly. Oxidation at elevated temperatures may raise or lower modulus unpredictably. Many beginners misread secondary relaxations as the main glass transition. Beta and gamma relaxations are real and often useful, especially in impact-modified polymers, but they occur at lower temperatures and should not be mislabeled as Tg.
Context makes the interpretation valuable. If a polyurethane foam shows a broad tan delta peak around the use temperature of a shoe midsole, that suggests strong damping and comfort but may also indicate changing support with climate. If an epoxy composite laminate retains high E’ to the service limit, it is better suited for structural stiffness. If a packaging film shows a low-temperature transition within transport conditions, brittleness and crack risk become likely. The best DMA reports do not stop at curves; they translate the curves into design and processing decisions.
Build a reliable DMA workflow for an educational resources hub
As a tutorial hub, DMA should connect to a broader testing workflow rather than stand alone. In practice, I use DMA alongside DSC for thermal transitions, TGA for degradation and filler content, rheology for melt behavior, tensile testing for bulk strength, FTIR for chemistry changes, and microscopy for fracture or morphology. Each method answers a different question. DMA is unmatched for small-strain viscoelastic behavior, but it does not replace large-strain mechanical tests or long-term environmental aging studies. Knowing what DMA can and cannot tell you prevents overclaiming from a single dataset.
For teams building an educational resources library, the most useful tutorials branch from the same foundation: sample preparation guides, fixture-selection guides, amplitude sweep tutorials, Tg interpretation examples, composite-specific methods, adhesive testing guides, and troubleshooting checklists. Internal links should point readers from this hub to those focused articles. The hub itself should remain practical: define the method, give the setup sequence, explain the core experiments, and show how to interpret results with standards and real material examples. That structure helps both new technicians and experienced engineers find the answer they need quickly.
A concise reporting template also improves consistency across labs. Include material identity, batch or formulation, specimen geometry, conditioning history, fixture type, preload, amplitude, frequency, atmosphere, temperature range, ramp rate, calibration date, and the exact transition criterion used. Add notes on anomalies such as slip, fracture, or visible warping. If you build this discipline early, comparisons across months, suppliers, and development projects become much easier. Reliable DMA is not just an instrument run; it is a controlled method with traceable decisions.
Performing dynamic mechanical analysis well comes down to a disciplined sequence: ask the right question, select the correct mode, prepare the sample carefully, confirm the linear viscoelastic region, run the sweep that matches the application, and interpret E’, E”, and tan delta together. When those steps are followed, DMA provides precise insight into stiffness, damping, molecular transitions, cure behavior, and service-temperature risk. It explains why materials that look similar in basic tests perform very differently in the field.
The main benefit of DMA is that it connects laboratory measurements to real-world conditions. Instead of relying on a single room-temperature property, you see how a material behaves across the temperatures and frequencies it will actually experience. That makes DMA valuable for material selection, failure analysis, formulation development, quality control, and process optimization. Used with standards such as ASTM D4065 and complementary tools like DSC and TGA, it becomes one of the most informative methods in a polymer and composites lab.
If you are building your knowledge under Educational Resources, use this article as the starting point for every DMA-related tutorial and guide. Standardize your setup, document your criteria, and compare like with like. Then move on to deeper topics such as fixture-specific methods, Tg reporting conventions, and troubleshooting artifacts so your next DMA dataset is not just complete, but decision-ready.
Frequently Asked Questions
What is Dynamic Mechanical Analysis (DMA), and what does it actually measure?
Dynamic Mechanical Analysis, or DMA, is a test technique used to measure how a material responds when a small, oscillating force is applied while conditions such as temperature, time, or frequency are changed. Instead of only asking whether a material is strong or weak, DMA shows how it behaves under realistic service-like loading where deformation and recovery happen continuously. This makes it especially valuable for viscoelastic materials such as polymers, adhesives, films, coatings, foams, elastomers, and many composite systems.
In a DMA experiment, the instrument applies a sinusoidal stress or strain and measures the resulting strain or stress response. Because viscoelastic materials do not respond instantly, there is usually a phase lag between the input and output signals. From that relationship, DMA calculates key properties including storage modulus, loss modulus, and tan delta. The storage modulus reflects the elastic or energy-storing portion of the response, which is often interpreted as stiffness. The loss modulus reflects the viscous or energy-dissipating portion, which is related to internal friction and molecular motion. Tan delta, the ratio of loss modulus to storage modulus, is widely used to assess damping behavior and identify transitions such as the glass transition temperature.
What makes DMA so practical is that one test can reveal far more than a simple tensile or hardness measurement. It can show when a material softens, when it begins to relax, how sensitive it is to temperature or loading rate, and whether molecular transitions are likely to affect performance in the field. For product development, quality control, formulation comparison, and failure analysis, DMA provides a direct view of how a material behaves under changing conditions that often resemble real-world use.
How do you perform a DMA test correctly from sample preparation to final run?
Performing DMA correctly starts with selecting the right test setup for the material and the question you want to answer. Before running the instrument, define the objective clearly. For example, are you trying to determine glass transition temperature, compare stiffness between formulations, evaluate cure state, study damping, or predict performance over a range of frequencies? The goal determines the temperature range, frequency, fixture type, and deformation mode you should use.
Sample preparation is one of the most important steps. The specimen must have consistent dimensions, smooth edges, and no defects such as voids, warping, uneven thickness, or residual damage from cutting. Small dimensional errors can produce large errors in modulus calculations, so thickness, width, and length should be measured carefully with appropriate precision. Samples should also be conditioned consistently, especially if the material is sensitive to moisture, residual solvent, or thermal history. In many polymer systems, prior processing and storage conditions can significantly influence the DMA result.
Next, choose the appropriate fixture and deformation mode. Common configurations include tension, compression, dual cantilever, single cantilever, and three-point bending. Thin films often perform well in tension, rigid bars are commonly tested in bending, and soft foams or elastomers may be tested in compression or shear depending on the instrument. The sample must be mounted securely without slipping, twisting, or being over-tightened. Poor clamping is a common source of bad data because it introduces compliance errors, sample damage, or motion that the software interprets as material behavior.
Before the main test begins, run the instrument checks recommended by the manufacturer. These usually include fixture calibration, force and displacement verification, temperature calibration, and baseline confirmation. Then determine the linear viscoelastic region by running a strain or stress amplitude sweep at a fixed temperature and frequency. This step is critical because DMA results are most meaningful when the material is tested under small deformations where the structure is not being permanently altered. If the strain is too high, the material may yield, crack, slip, or show nonlinear behavior that obscures the true viscoelastic response.
Once the linear range is established, select the actual test program. A temperature ramp is commonly used to locate thermal transitions such as the glass transition. A frequency sweep is useful for understanding rate dependence and comparing how a material behaves under slow versus rapid loading. A time sweep can be used for cure monitoring, aging studies, or stability evaluation at constant conditions. During the run, monitor force, displacement, phase angle, and sample condition. If the sample buckles, fractures, detaches, or shows sudden signal instability, stop and inspect the setup rather than assuming the software output is valid.
After the run, review the full data set rather than relying on a single peak or value. Check whether the modulus trend is physically reasonable, whether tan delta peaks are well-defined, whether there are signs of clamp slip, and whether repeat runs agree. Good DMA practice combines careful preparation, correct geometry, controlled test conditions, and thoughtful interpretation. When those elements are handled well, DMA becomes one of the most reliable tools for understanding how materials perform as conditions change.
How do you choose the right DMA test mode, fixture, temperature range, and frequency?
Choosing the correct DMA conditions begins with understanding the material form and the performance question. There is no universal method that fits every sample. A rigid thermoplastic bar, a pressure-sensitive adhesive, a thin coating, and a low-density foam all respond differently and require different fixtures and loading modes. The best DMA setup is the one that subjects the sample to controlled deformation without introducing artifacts such as buckling, clamp slip, crushing, or excessive fixture compliance.
Fixture selection is usually driven first by sample geometry. Films and fibers are commonly tested in tension because they can be gripped and elongated uniformly. Molded bars and composite strips are often tested in single cantilever, dual cantilever, or three-point bending. Soft rubbers and foams may be better suited to compression or shear-like modes because tensile gripping can be difficult and bending can be dominated by geometry rather than intrinsic material behavior. Adhesives and coatings may require specialized fixtures or preparation on a supporting substrate, depending on whether you are measuring the bulk material, the cured layer, or an assembly response.
The temperature range should bracket the transitions or service conditions you care about. For a polymer, that often means testing below and above the expected glass transition temperature so you can see the full change from a glassy state to a leathery or rubbery state. If the material may crystallize, melt, cure further, oxidize, or degrade, those effects must also be considered when setting the upper temperature limit. Starting too close to a transition can cause you to miss baseline behavior, while heating too high can permanently alter the sample and make the later part of the test difficult to interpret.
Frequency selection matters because viscoelastic response depends strongly on loading rate. A material that appears stiff at high frequency can appear much softer at low frequency. For many routine comparisons, a single frequency such as 1 Hz is used as a practical benchmark. However, if the material will see vibration, impact-like loading, long-term static loading, or cyclic flexing in service, a frequency sweep often gives a more realistic picture. The key is to match the test frequency as closely as possible to the application, while staying within the instrument’s reliable operating limits.
It is also important to consider amplitude. DMA should generally be performed within the linear viscoelastic region, so an amplitude sweep is often used before the main test. If the sample is too soft at elevated temperature, the amplitude may need to be reduced to prevent overstraining. If the sample is very stiff, the amplitude must still be large enough to produce a clean signal above the noise level. In practice, the right DMA method is chosen by balancing material type, specimen geometry, intended use conditions, and instrument capability. That balance is what turns a generic DMA scan into meaningful engineering data.
How do you interpret DMA results such as storage modulus, loss modulus, and tan delta?
Interpreting DMA data starts with recognizing that each output describes a different part of material behavior. Storage modulus, often written as E’ or G’ depending on the test mode, represents the elastic component of the response. It tells you how much energy the material stores and recovers during each loading cycle, so it is commonly treated as a measure of stiffness. A high storage modulus usually indicates a more rigid material, while a drop in storage modulus as temperature rises often signals softening or a transition in molecular mobility.
Loss modulus, often written as E” or G”, represents the viscous component of the response. It shows how much energy is dissipated as heat through internal molecular friction and rearrangement. Peaks in loss modulus often indicate increased molecular motion and can help identify transitions, relaxations, or temperature regions where the material is actively dissipating energy. In practical terms, materials with a higher loss component may absorb vibration better, but they may also generate more heat or show greater sensitivity to cyclic loading conditions.
Tan delta is the ratio of loss modulus to storage modulus and is one of the most widely referenced DMA outputs because it captures damping behavior in a simple way. A high tan delta generally means the material dissipates a larger fraction of energy relative to what it stores. This is useful when evaluating vibration damping, noise reduction, impact energy dissipation, or transition behavior. The peak in tan delta is often used as a marker for glass transition temperature, although it is important to remember that Tg can be reported differently depending on whether it is taken from the onset of storage modulus drop, the